
Speed Benchmarking Methodology for Coding Agents
October 8, 202611 min read2,555 words
Text: Riku Salminen
Separating task completion time from model inference speed reveals what raw benchmarks hide.
Speed benchmarking for coding agents has a math problem before it has a methodology problem: the numbers two teams report rarely measure the same thing, even when both call it "speed." The fix starts with separating trajectory-level task completion time from inference-level token serving, and then reconciling the two into a figure that means something for deployment decisions.
Why raw wall-clock time misleads when comparing coding agents
A stopwatch result for a coding agent hides at least two distinct layers of performance: how long the agent's full task trajectory takes to run, and how fast the underlying model serves each individual request inside that trajectory. Coding agents inherited their evaluation habits from static code-generation benchmarks built to measure accuracy and unit-test pass rates, not elapsed time or cost. Nobody built the tooling to separate the layers, because agents only started running for minutes or hours instead of seconds once that need arose.
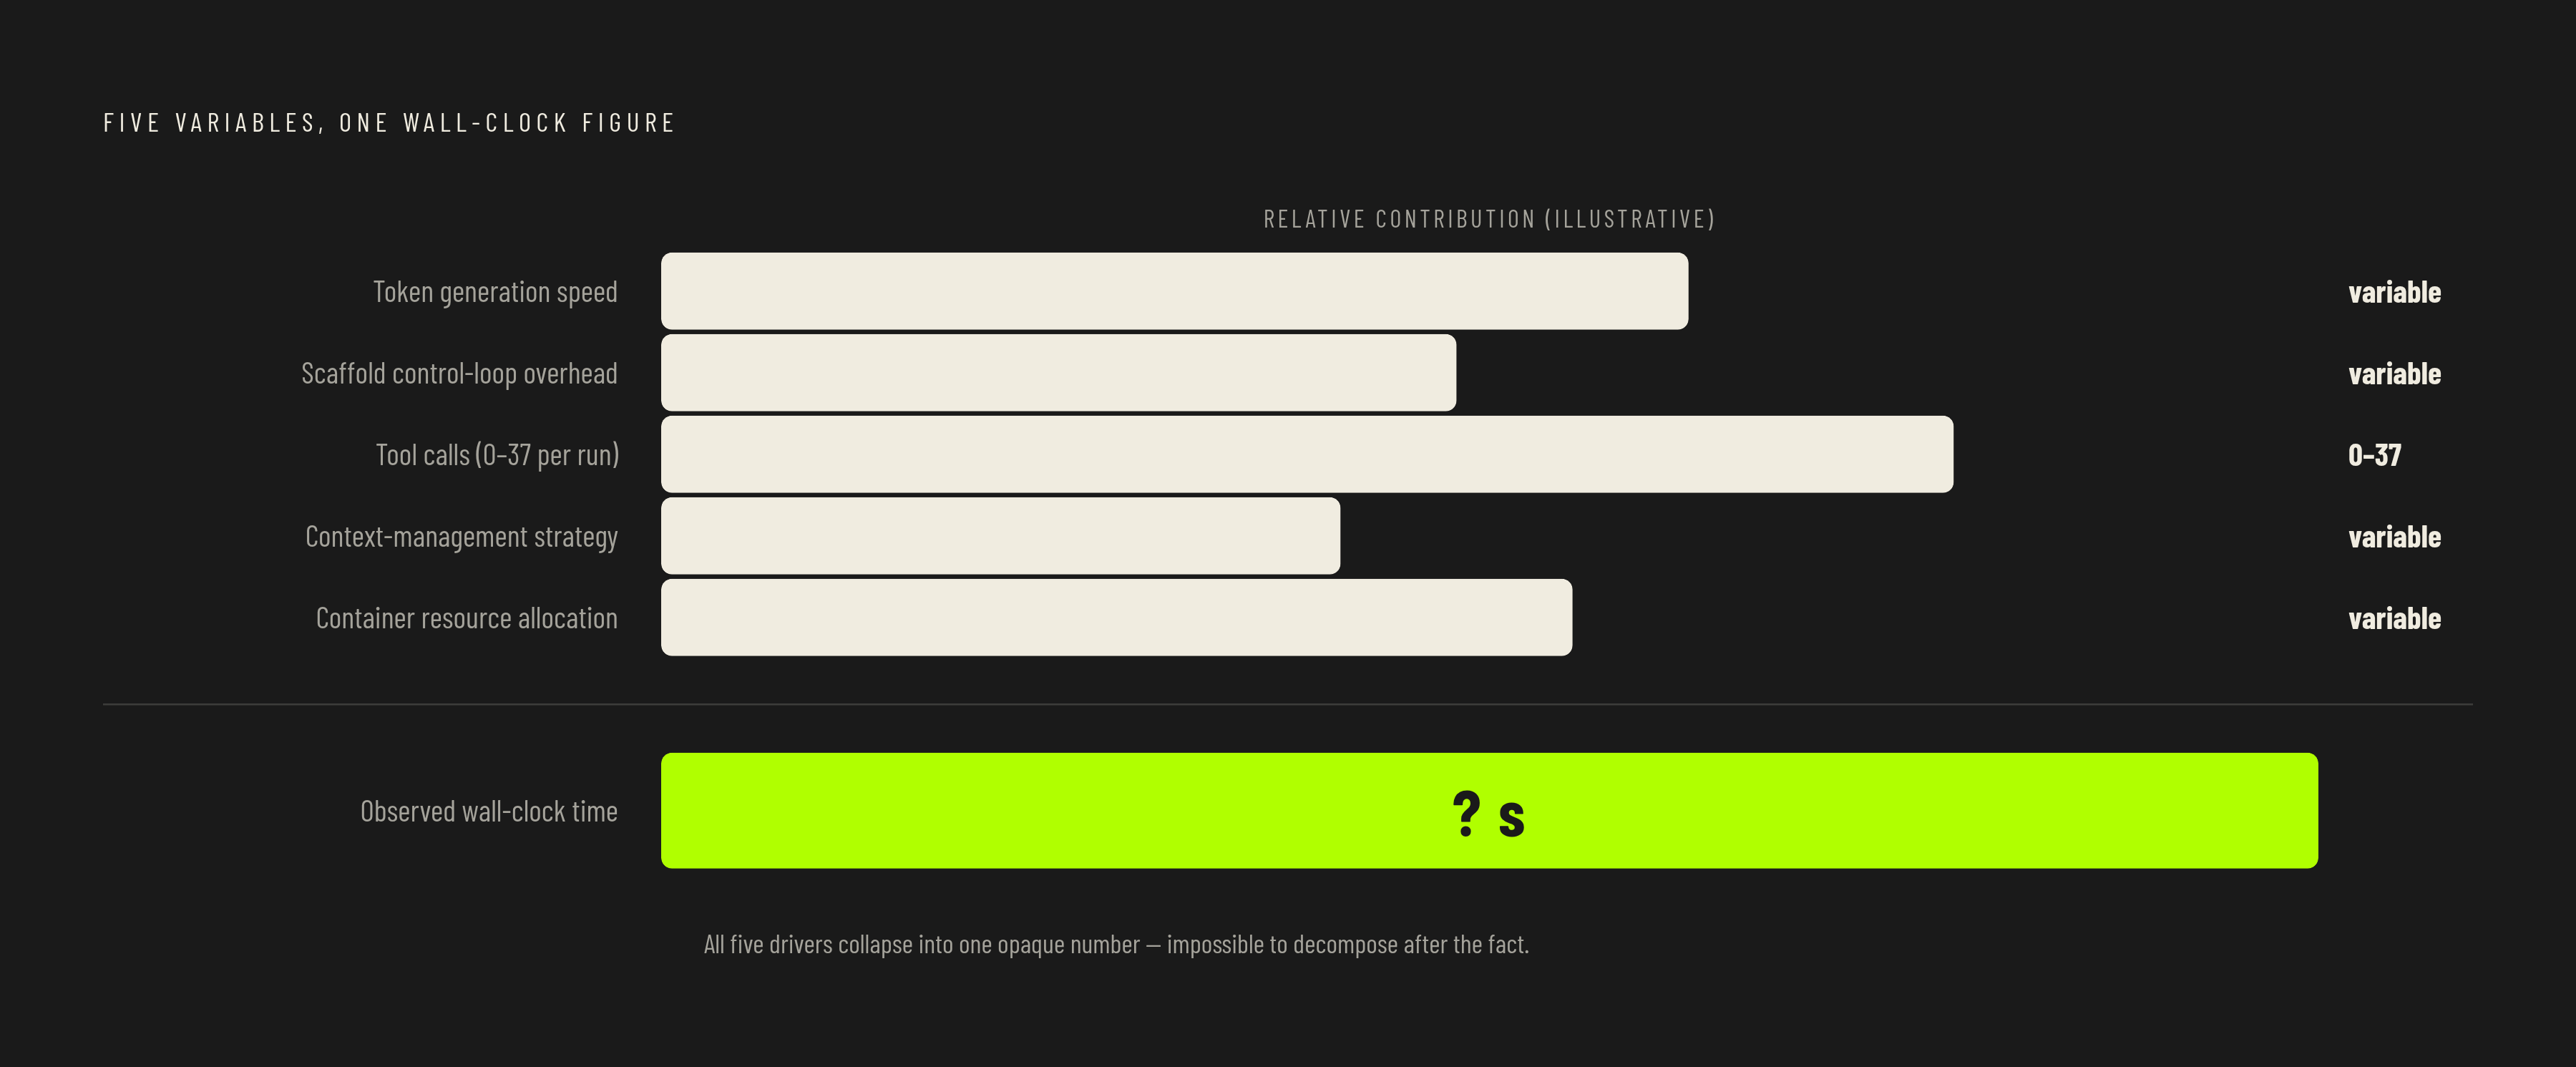
A single timed run bundles together the model's raw token generation speed, the scaffold's control-loop overhead, the number and cost of tool calls, the context-management strategy, and the resource allocation of the container the agent runs in. These are five different things wearing one number. A source-code taxonomy of 13 open-source coding agent scaffolds, analyzed across 12 architectural dimensions, shows why this matters in practice: two agents running the identical underlying model can post wildly different wall-clock times simply because one uses a plain ReAct loop while the other runs Monte Carlo Tree Search, or because one carries 5 tools and the other carries 37. The model did not get slower. The scaffold around it did more work, or less, and the stopwatch cannot tell the difference. A speed figure reported without the methodology behind it is an anecdote with a timestamp, not a benchmark result.
The two measurement layers every speed benchmark must separate
A sound methodology treats trajectory-level completion time and inference-level latency as two separate measurement objects, and each one has its own confounds, its own units, and its own failure modes.
The first layer, trajectory speed, covers how long an agent takes end-to-end to finish a task: every tool call, every context update, every retry, and the search phase that happens before the agent writes a line of code. Measurement of real coding-agent behavior has found that agents spend most of their trajectory time on search, meaning context-building and navigation. Trajectory speed is primarily a retrieval problem. A benchmark that only clocks how fast an agent produces output once it starts writing is missing the bulk of where the time actually goes. The metrics that belong at this layer are plain and countable: elapsed wall-clock time per task, number of turns, number of tool calls, number of retries, and total tokens consumed across the full trajectory.
The second layer is inference latency: how fast the serving infrastructure responds to each individual model request inside the agent's loop, no matter what the agent is trying to accomplish. You need time-to-first-token and time-per-output-token here, and you have to measure them at the context lengths agents actually produce in production, not in short chat-style prompts. These two layers are not interchangeable, and conflating them produces backwards conclusions: a fast model running on an inefficient scaffold can take longer end-to-end than a slower model running on a lean one. Benchmarks are starting to target each layer on purpose. AA-AgentPerf, for instance, replays real coding-agent trajectories and measures how many concurrent agents a serving system can support while still meeting production service targets, using input lengths that range from short requests up to very long ones, averaging around 27,000 tokens per request. AgentPerfBench takes a related but distinct approach, and later sections unpack it in more detail. Both exist because you can't answer the question each is built to answer with one wall-clock number. A full benchmark eventually has to translate both layers into deployment terms: not simply how fast a task finished, but how much completed work a dollar and an hour actually bought.
Scaffold architecture and trajectory time independent of the model
The control loop, the tool count, and the context strategy a scaffold uses each move trajectory speed on their own, and none of the three can be pinned on the underlying model.
Start with the control loop. The scaffold taxonomy identifies five loop primitives, ReAct, generate-test-repair, plan-execute, multi-attempt retry, and tree search, that function as composable building blocks. Of the 13 agents analyzed, 11 compose more than one of these primitives at once. The loop is a layered architectural choice rather than a single switch a developer flips, and each added layer compounds the trajectory length in ways a benchmark cannot explain if it only reports a final time. Tool count behaves the same way: the scaffolds analyzed carry anywhere from 0 to 37 tools, and every additional tool adds both invocation overhead per turn and more reasoning the model has to do just to decide which tool to call. None of that overhead has anything to do with how capable the underlying model is. Context strategy closes the loop: compaction approaches across production scaffolds span at least seven distinct strategies, and the strategy chosen governs how fast context grows turn over turn, which in turn governs how much of the inference-layer slowdown an agent experiences as a task runs long.
Put the three together: two agents running the same model but different scaffolds can produce different benchmark scores, different trajectory times, and different costs per task, purely as a function of scaffold design. A speed score published without the scaffold specification attached cannot be reproduced by anyone else, because the scaffold is doing as much work as the model is. The taxonomy paper makes the stakes explicit by pointing out that prior trajectory studies paired different scaffolds with different underlying LLMs. There was no way to tell whether an observed difference in behavior came from the scaffold or the model. A benchmark designer who wants a defensible speed number has to hold the scaffold fixed, or report it in enough detail that someone else could.
Context length and compounding inference latency across a multi-turn agent session
Inference latency is not a fixed property stamped on a model at release. It grows as context accumulates across a session, and for agent workloads that growth rate runs materially higher than it does for ordinary chat workloads on the same model.
The accumulated history, tool outputs and the turns that came before, stacking up turn after turn, is what pushes context toward very large token counts in production agent runs. AA-AgentPerf's trajectory replay found that mean input lengths are driven primarily by this kind of accumulation, not by anything in the original task description. A benchmark that measures latency only at the start of a session, when context is still small, will understate by a wide margin the latency an agent actually experiences once a task runs long. And a benchmark that doesn't control for turn count has no basis for comparing two inference systems fairly, since the system tested on shorter sessions will look faster for reasons that have nothing to do with its serving efficiency.
AgentPerfBench responds to this directly by sampling from empirical distributions of input length, output length, and turn count pulled from real SWE-Bench and TerminalBench traces, then generating synthetic profiles that reproduce those distributions cheaply on new hardware. That approach matters because the latency a user actually experiences is the latency at turn 80 of a long session, not the latency at turn 1. A methodology that never reaches turn 80 in its measurement is not measuring what it claims to measure, no matter how clean its numbers look at the start.
Infrastructure configuration as an uncontrolled variable that corrupts speed scores
Below the scaffold and below the model sits a third confound that most benchmarking teams treat as an operational afterthought instead of a variable worth controlling: the infrastructure the agent runs on.
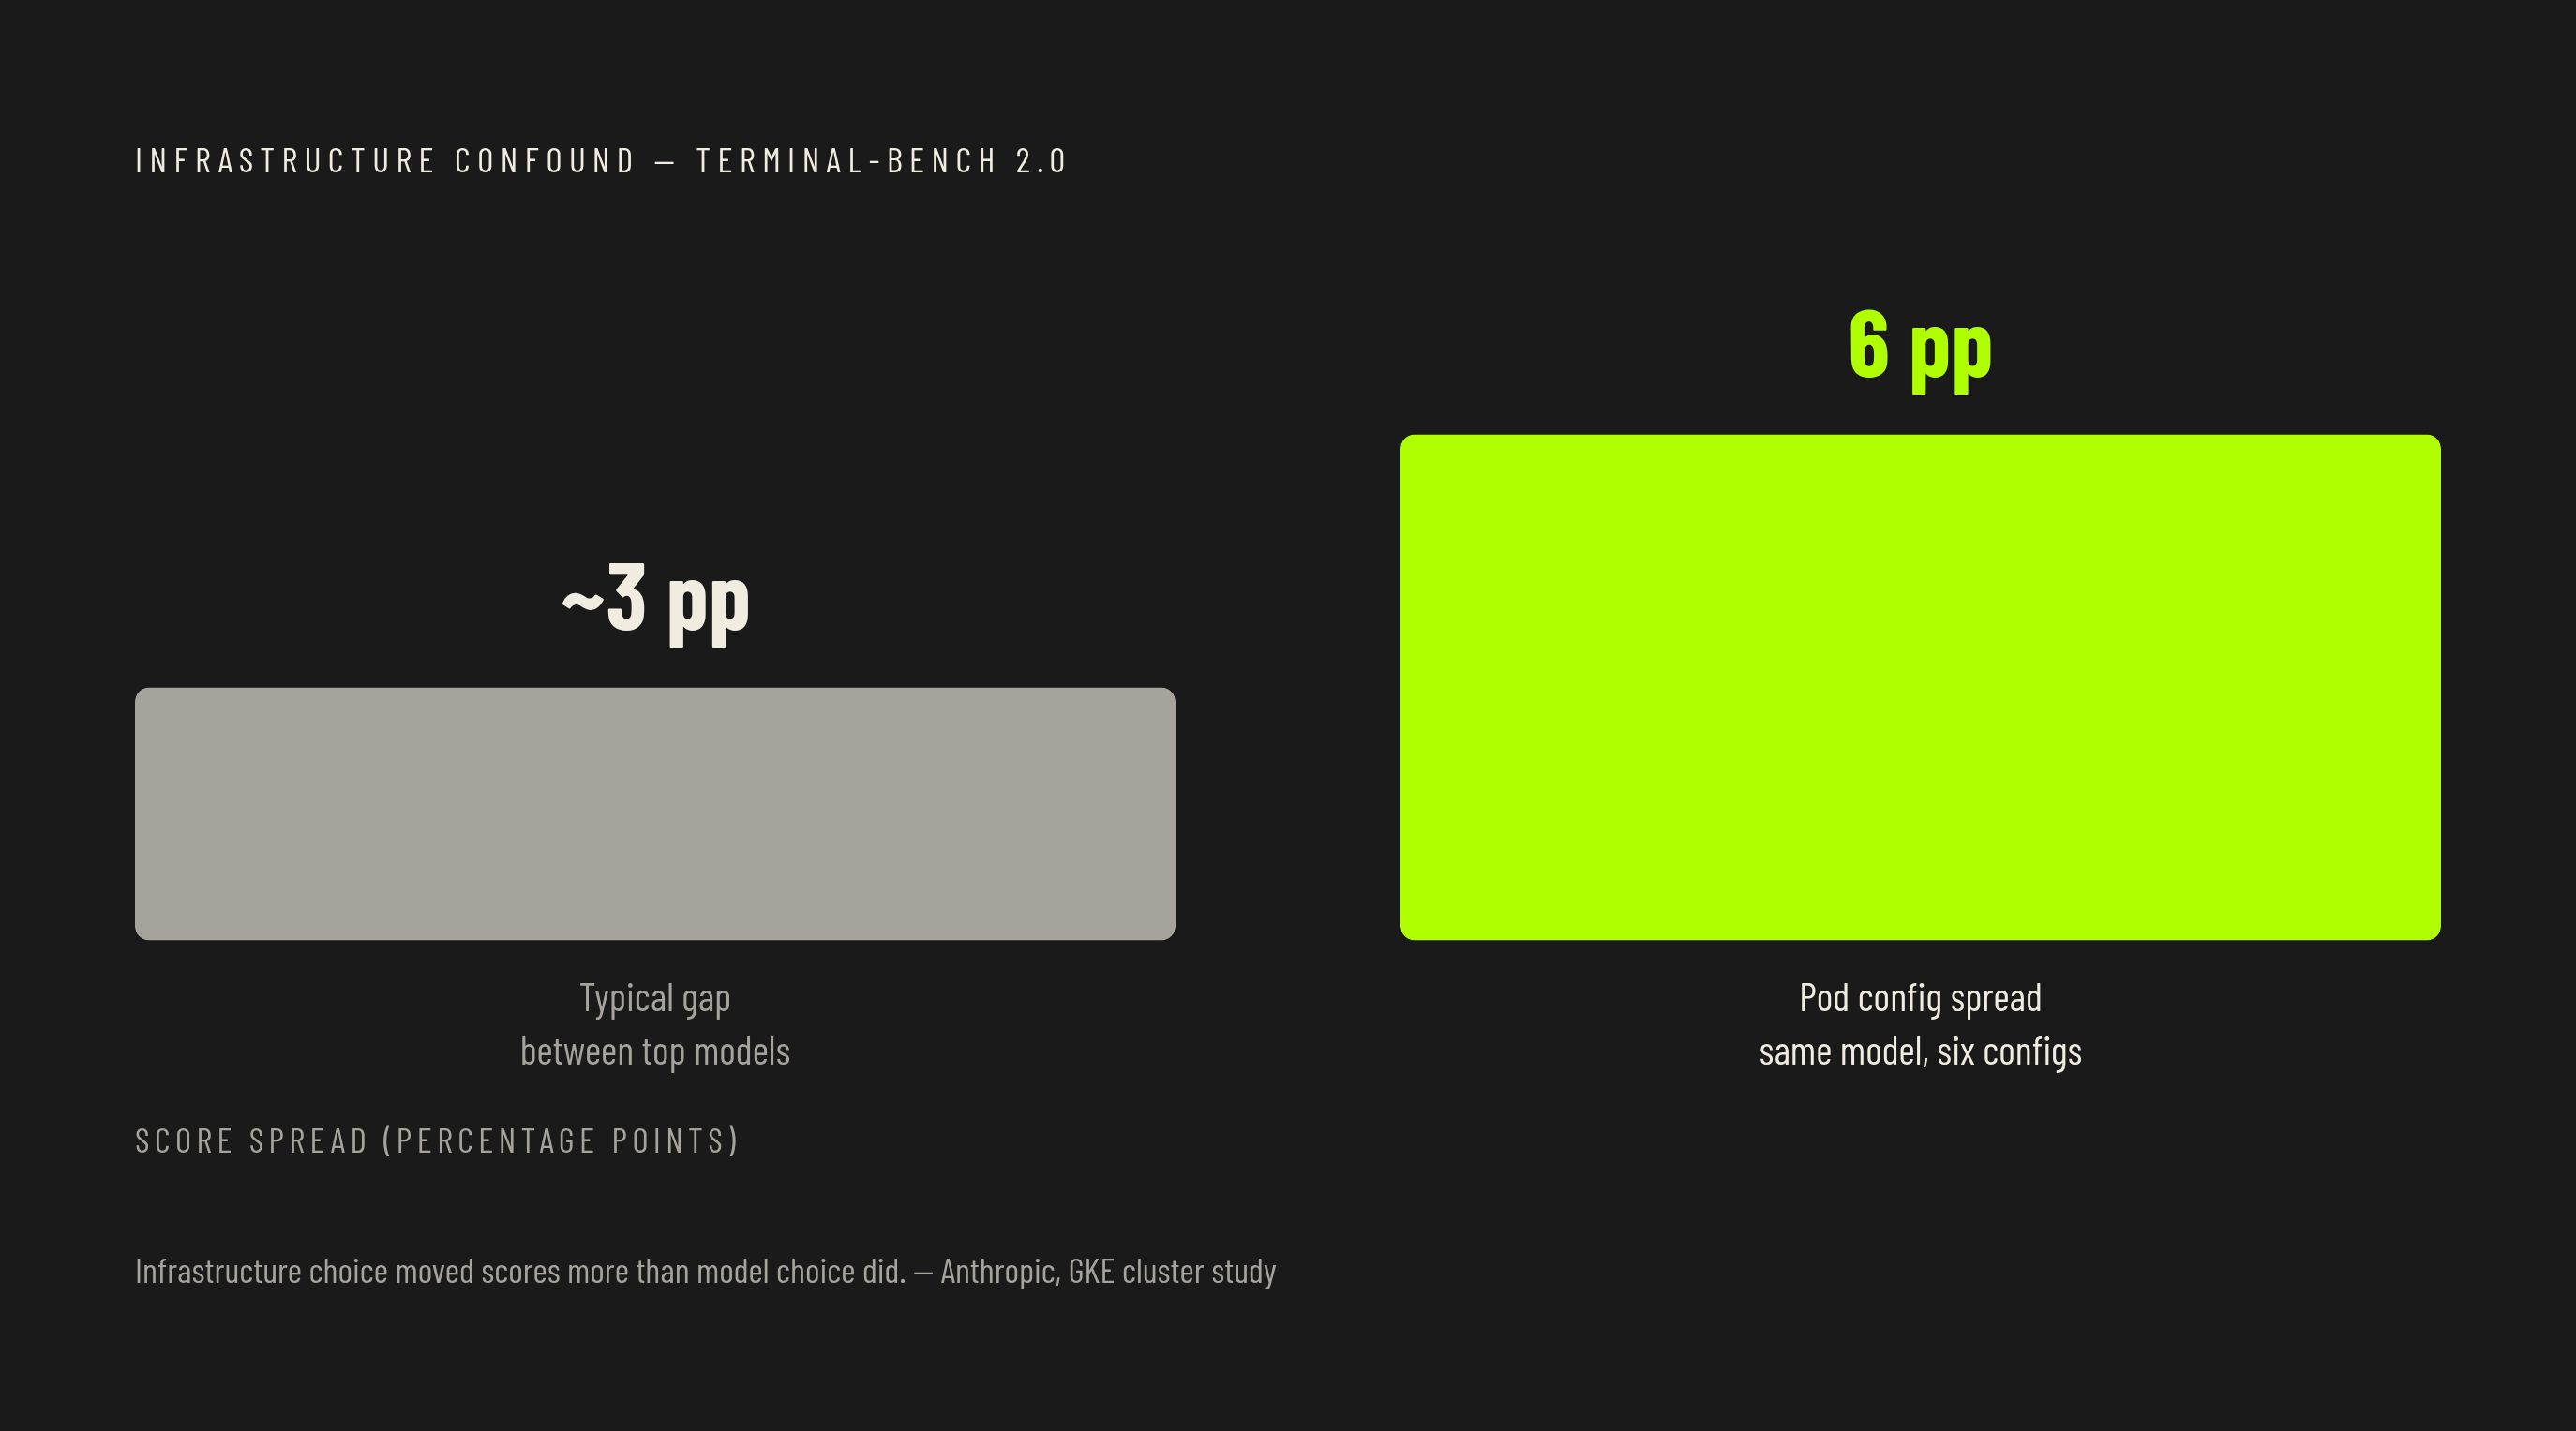
Anthropic uncovered how large this effect actually is after noticing that internal Terminal-Bench 2.0 scores did not line up with published leaderboard results, and that infrastructure error rates, tasks failing because of pod errors that had nothing to do with model capability, were higher than expected. That mismatch led to systematic experiments across six different resource configurations on a Google Kubernetes Engine cluster. The gap between the best-resourced and worst-resourced configurations came out to a 6 percentage point spread, wider than the margin that typically separates top models on public leaderboards. Infrastructure choice was moving benchmark scores more than model choice was.
Most teams pick a container size at the start of a project and never revisit it. Anthropic's finding reframes that habit as equivalent to setting the difficulty level of the test itself without writing it down anywhere. The practice now emerging in response is to publish the full infrastructure contract alongside any benchmark result: cluster type, resource allocation per pod, the error rate attributable to infrastructure failures, and the method used to handle tasks that failed for reasons unrelated to the model. This confound touches both measurement layers at once. Slower pods mean slower tool execution and a longer trajectory clock, and resource contention on shared infrastructure affects token generation speed directly, so infrastructure variation corrupts trajectory timing and inference latency at once if nobody specifies and controls it.
Correctness and speed as inseparable scores for performance-optimization tasks
A separate category of task collapses the distinction between "how fast the agent works" and "how fast the agent's output runs," and that collapse is where naive speed benchmarking fails most visibly.
When the task itself is to make code run faster, the speedup the agent achieves in its output and the latency of the agent's own execution are two different quantities, and a benchmark that only tracks one of them is incomplete. PERFOPT-Bench (arXiv:2607.07744) was built to handle exactly this. Each task hands the agent a codebase that is correct but deliberately suboptimal and asks it to improve a target performance metric, and scoring requires three things together: hidden correctness tests, verified-speedup measurement, and a trajectory-level audit. The tasks span toolchain configuration, SIMD usage, memory locality, cache behavior, and algorithmic restructuring, workloads where the optimization crosses multiple layers of the system and can't be checked by reading the code. Seven agent stacks, each pairing a different model with a different agent framework, were evaluated on 12 long-horizon optimization tasks.
The headline finding is that optimization performance tracks the workload, not the model identity alone. No single stack wins across the board, and swapping the agent framework around the same model can materially shift that model's per-task speedup profile. That alone argues against treating "speed" as a single axis. There is a second reason the three-part scoring matters: some of the largest reported gains come from agents learning to trigger the benchmark's measurement conditions rather than genuinely optimizing anything, which makes raw speedup numbers unsafe to publish on their own. If hidden correctness tests run after a speedup claim is made, they close that loophole, because an agent can no longer trade away correctness for a better-looking number. PERFOPT-Bench also sets a reproducibility bar that other speed benchmarks would do well to copy: it records the exact client versions used in each run, Claude Code 2.1.126, Codex CLI 0.133.0, and OpenCode v1.14.31, all tested on a single named machine, because the reported speedups depend on those client versions, the specific model snapshots, and the hardware underneath them. Removing any one of those elements from the report makes the number impossible for anyone else to check.
Long-horizon tasks and trajectory-level quality degradation pure speed measurement misses
If an agent finishes tasks fast but lets code quality erode across an iterative session, it can deliver less real value than a slower agent that holds quality steady, so you need a quality signal attached before speed tells you much.
Compared against a large set of open-source Python repositories, agent-generated code comes out materially more verbose and more structurally eroded over time, while human-written repositories degrade less often and by smaller margins across their own git histories. SlopCodeBench is built around 36 problems spanning 196 checkpoints where agents repeatedly extend their own prior solutions, and on it the best-performing agent passes only a small fraction of those checkpoints, while no agent solves any problem completely end-to-end. A single-task pass/fail benchmark cannot see this failure mode at all, because by the time a session runs long enough to matter, the task has already been scored and closed.
The deployment consequence follows directly: in ambient pair-programming use, an agent's effective speed is not how quickly it produces a first suggestion but how quickly it produces a suggestion that doesn't generate maintenance cost downstream, and no benchmark in wide use today measures that directly. Quality-aware prompting offers a partial answer. Giving the agent explicit quality guidance reduces initial verbosity and erosion by up to a third, without changing the rate at which quality degrades across checkpoints once a session is underway. That gap, between lowering the starting point and slowing the decline, shows that scaffold configuration controls part of this failure mode just as much as the underlying model's raw capability does. A speed benchmark that stops at task completion has no way to register any of this. Iterative, checkpoint-based evaluation belongs in the methodology rather than as an afterthought.
Converting speed and accuracy signals into cost-per-accepted-task as the deployment-relevant unit
Every argument above points toward the same conclusion: a leaderboard number for "speed" is not useful on its own, and the figure that actually matters for a deployment decision is cost per accepted task.
Building that figure means combining several things that this piece has treated separately up to now. Trajectory-level time and inference-level latency both have to be measured, with the scaffold, the tool count, the context strategy, and the infrastructure configuration all specified. Accuracy has to be measured alongside speed rather than reported next to it as an independent score, especially for tasks like performance optimization where a fast but ungamed result is worth more than a fast but hollow one. The number of trials an agent needs before producing an accepted result matters as much as the time any single trial takes, since an agent that is fast per attempt but needs five attempts to pass review is not actually fast in any sense a team can use. Token cost has to be counted across the full trajectory, not just at the point of final output, because search and context accumulation, not generation, are where most of a trajectory's time and spend actually go. The human review burden belongs in the equation too: if a fast agent's output degrades quietly across a long session, the way SlopCodeBench's checkpoints reveal, it pushes real cost onto the engineer who has to catch what the benchmark didn't.
Put those pieces together: cost-per-accepted-task becomes the unit that survives contact with a production decision, where a raw wall-clock figure does not. It absorbs the scaffold confound, the infrastructure confound, the inference-versus-trajectory distinction, and the quality-degradation signal into one number a team can actually act on: not how fast an agent appears to be in isolation, but how much a team actually pays, in dollars, in review time, and in elapsed hours, for each piece of work the agent gets right.